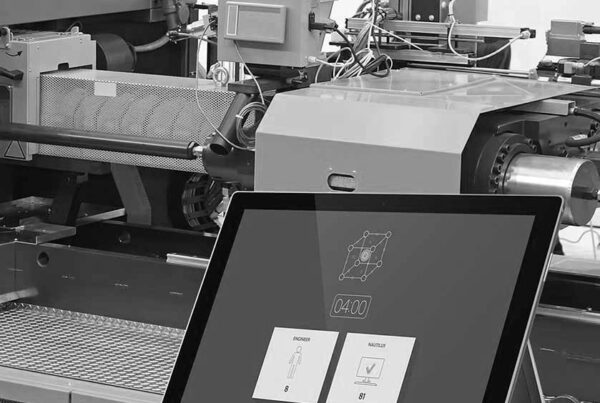
Based on the users selected parameters the software designs the needed experiments to find out the effects each parameter has on the end product. In de Tornedo chart below the software shows that the molding pressure parameter has the most effect on the end result.
A = Mold Temperature B = Cooling Time C = Molding Pressure D = Viscosity E = Cavity Balance F = Gate Seal
After the experiments and data input is done to the worksheets. The software creates visual graphs and tables to show the limits and goldspots of each parameter inside the process to produce acceptable parts. Below you see the minimum and maximum preset of the molding temperature.
Upper en lower specification limit
Molding temperatures >83° – <106°
Molding temperatures >83° – <106°
The user now has created the most optimised process and has all the information on the Overall Equipment Effectiveness.
The software used to create the design off experiments has many other tools for your injection molding process. Next to design of experiments there are worksheets, databases, mold machine compatibility matrix and more. Check out all the features and benefits of our software below.